This is the first in a series of posts from Parrot Analytics, looking at which local content performs best at home and globally.
Like many countries, the UK has a proliferation of platforms on which consumers can watch content on demand. However, many of the most prominent VOD services in this country are not subscription services, but free to watch catch-up services. Some of these catch-up platforms are ad-supported, while others like the BBC iPlayer are completely free. The trade-off for no fee is usually that the catch-up services have limited viewing: typically the broadcaster catch-up services only allow viewing of episodes of shows for two weeks after the airing of that episode.
So, the question is, which type of platform is more popular in the UK: subscription or catch-up?
In this post, Parrot Analytics will examine demand data from the UK to answer this question. We start by gather demand data for the catalogues of the eight largest VOD platforms. This is a slightly tricky metric to obtain as the catalogues offered by each platforms are constantly changing. SVOD platforms tend to gain and lose titles on a monthly basis while, as mentioned previously, the catch-up services change what they show based on episode broadcast dates. To make this comparison as fair as possible, data from a two-week range is used. This short timeframe ensures that the impact of title availability is as minimal as possible.
Using our catalogue demand data, we can now find the average demand for a title on each type of platform:
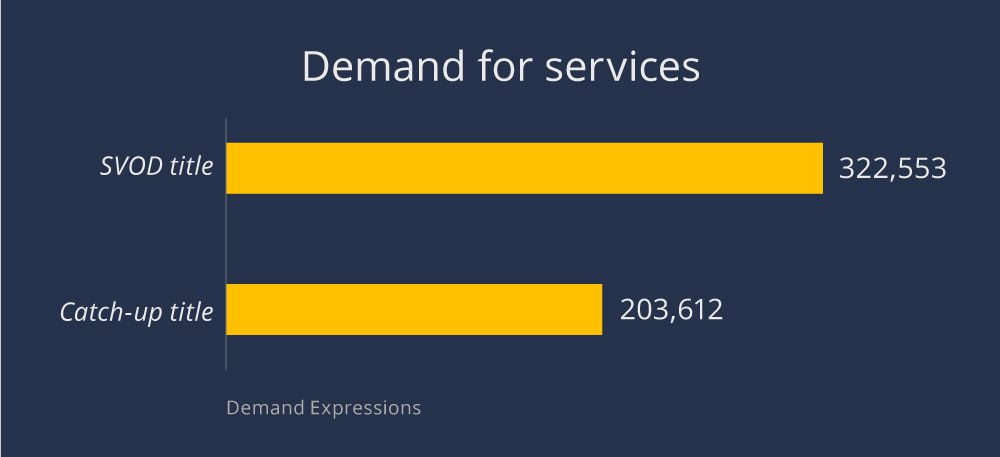
This shows that the average title on an SVOD has approximately 150% of the demand of a title on a catch-up service. This makes sense; it’s hard to persuade consumers to pay a monthly fee without attractive titles so SVODs select for popular, in-demand titles.
We now break down the average demand per title further by calculating the average demand for a title on individual platforms.
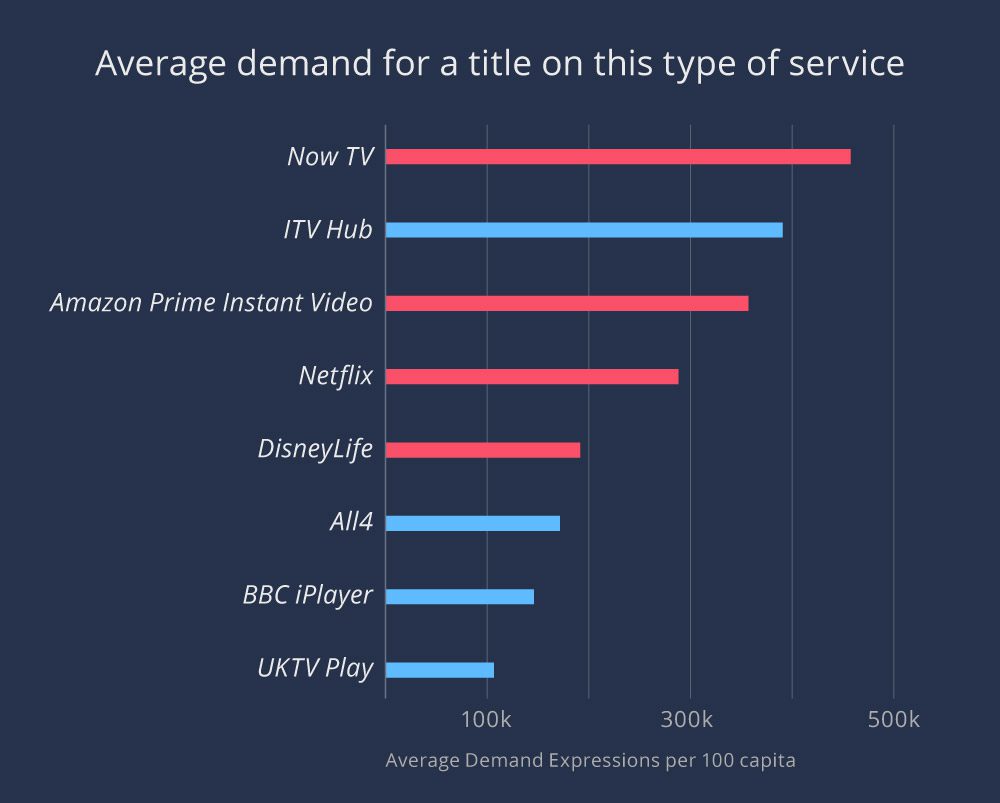
This reveals some unexpected results. Netflix and Amazon – the big name SVODs – don’t top the list of highest average demand. Neither does the BBC – the broadcaster may rule the UK’s airwaves but is near last in average demand for its iPlayer.
As touched on earlier, SVOD catalogues have to appeal enough to consumers to justify a monthly fee while the broadcaster catch-up services do not have to worry about that as their catalogue is determined by what is broadcast. This fact is broadly reflected in the average demand here; the SVODs are generally successful in making sure there is demand for the titles they offer.
However, the high average demand for Sky’s Now TV – beating competitors Netflix and Amazon – is less surprising when you consider that the platform’s biggest show is Game Of Thrones. This show was releasing season 7 during the 2 weeks considered and so had a huge amount of demand. This is not the sole factor though; many of Now TV’s other titles are also very popular current titles such as Twin Peaks and The Flash.
The top catch-up service and second placed by average demand is ITV Hub, which has over twice as much average title demand than the next catch-up, All4. This service’s most in-demand titles during the two weeks were more focused on comedies; animated sitcoms Family Guy and American Dad were the top 2 titles, followed by reality show Love Island.
All the other SVOD services are clustered together, followed by the other broadcaster catch-up services. With a catalogue of mostly older, niche titles, UKTV Play has the lowest average demand for a title.
We now go even further into the data and separate out demand for each genre by platform.
UK VOD Demand for Drama by platform
This chart represents the summed demand for all the drama titles on the VOD platforms listed, divided by platform.
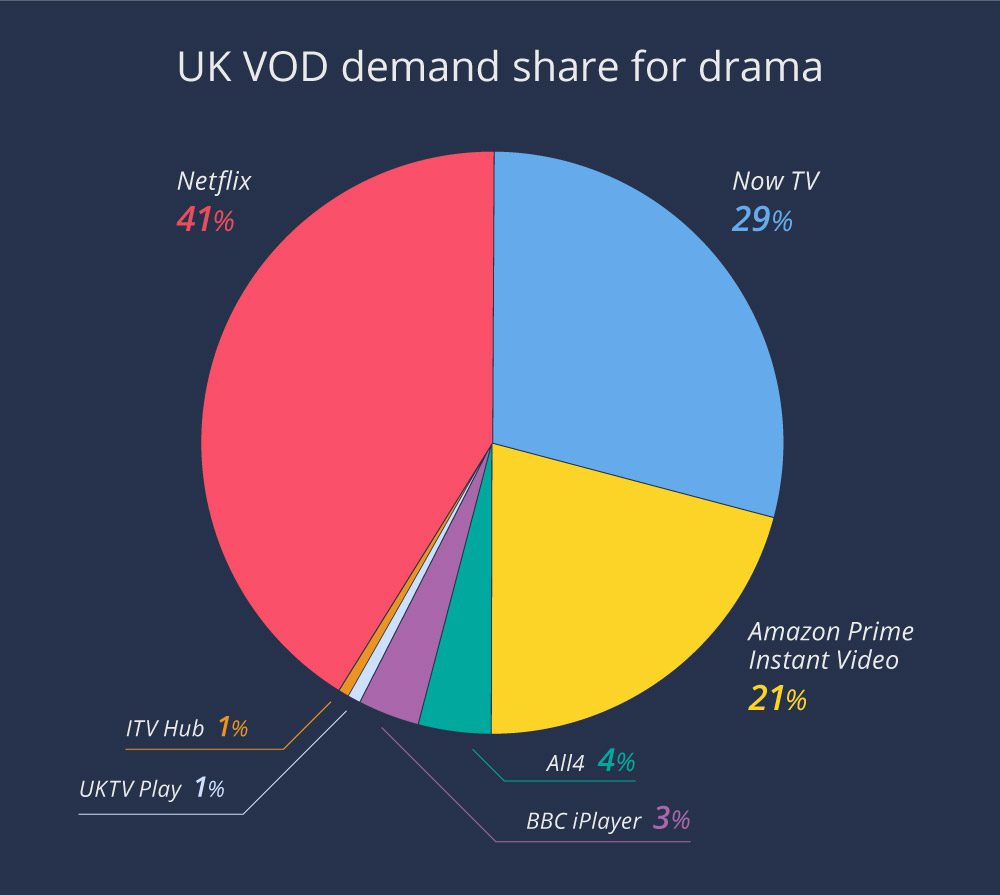
Again, Now TV having Game of Thrones guarantees it has a large share of the drama demand. However, the strength of Netflix’s large catalogue of original drama titles shows here as it has a 12% lead over Now TV.
Amazon Prime Instant Video also has a respectable chunk of the UK’s VOD demand for drama, driven by such titles as The Walking Dead, Preacher and Prison Break.
The catch-up service with the biggest share is All4, with that platform’s most in-demand drama being the critically acclaimed Handmaid’s Tale.
The low demand share for the catch-up services is initially a little unexpected; the BBC for example has many popular dramas. However, catch-up services by their nature only carry a few episodes of a show at a time. Further, these shows were broadcast to a general audience less than two weeks ago; demand for the title may well have been mostly expressed at that time rather than for this “digital repeat”.
UK VOD Demand for Comedy by platform
The result is even stronger for Netflix in the comedy genre. The platform’s recent focus on comedy is clearly paying off – it has over half of the UK VOD demand for that genre. As it was in drama, Now TV is the second biggest VOD, this time with 27% driven by such shows as South Park and Modern Family.
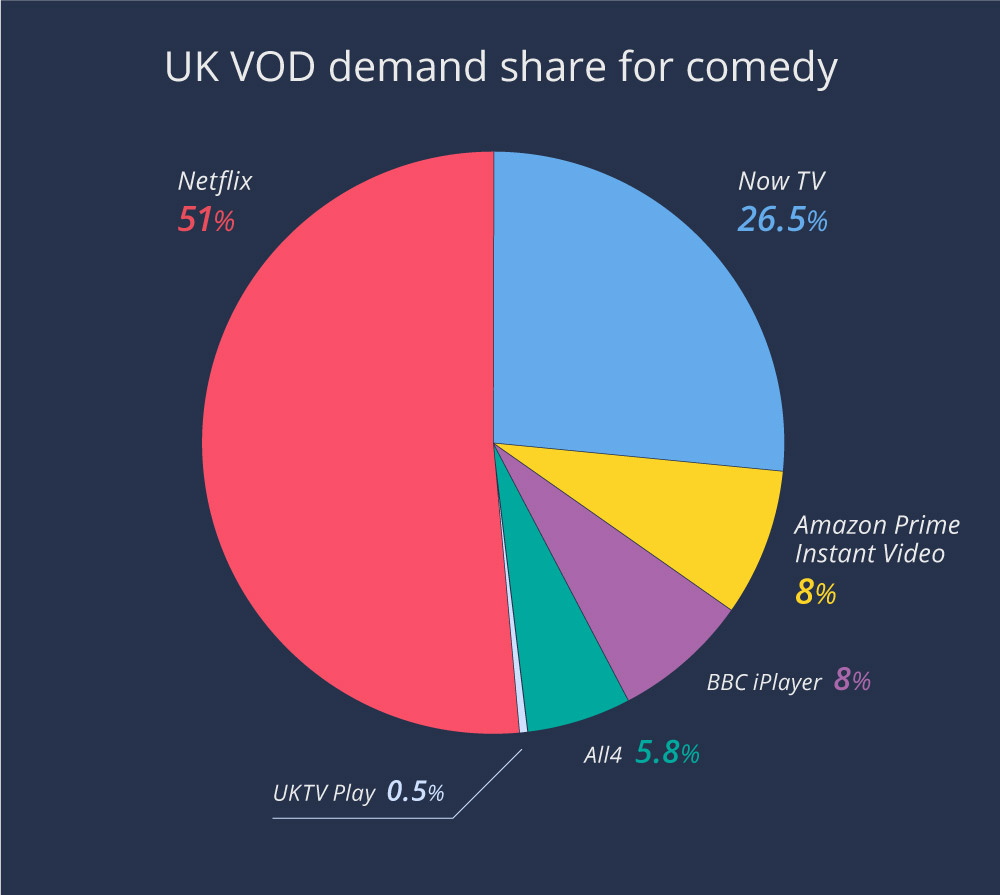
Amazon and BBC iPlayer both have 8%, which represents a 3% increase in share over the drama share for BBC iPlayer but a 13% decrease for Amazon.
All4 has 6% while the other services have less than a percent of VOD comedy demand.
UK VOD Demand for Children’s content by platform
Finally, we will see how demand for children’s content is distributed:
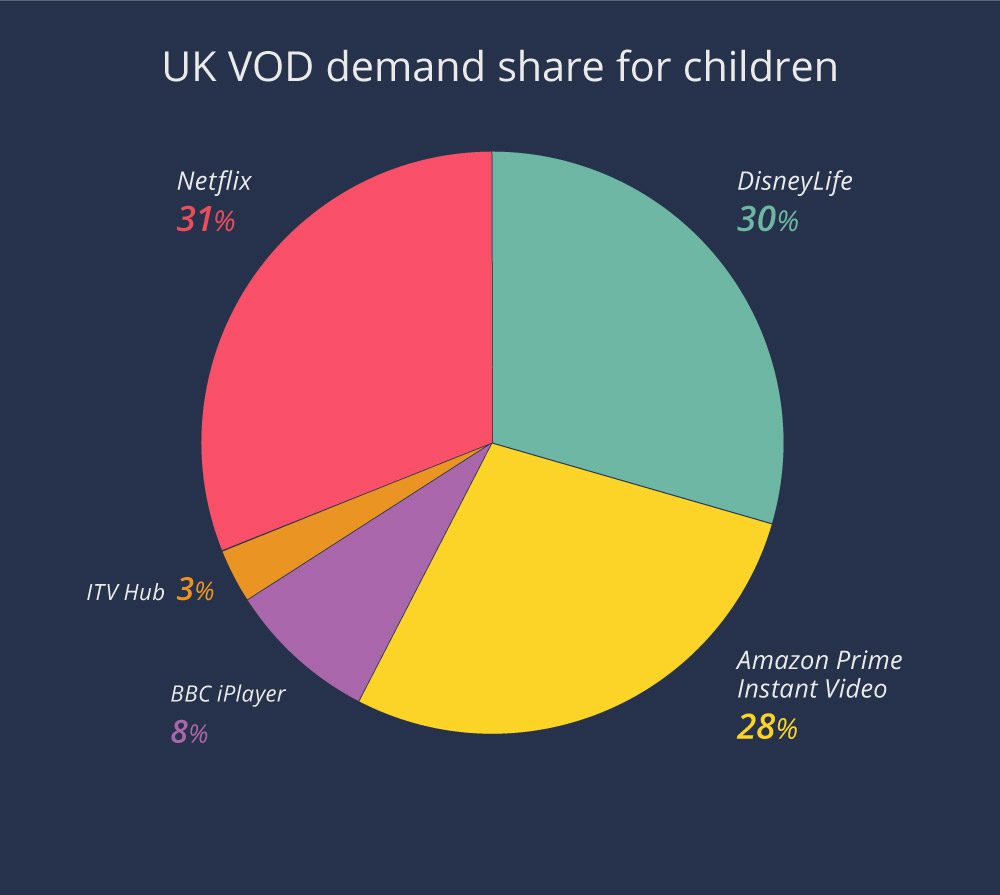
It’s a fairly even battle here between DisneyLife, Netflix and Amazon, all of which have strong children’s catalogues and all of which have around 30% demand share. Most of the remainder of the genre demand is for the BBC iPlayer with an 8% share, while ITV Hub trails in last with 3%. The other three services do not have significant demand in this genre and so are omitted from the chart.
Conclusion
When it comes to VOD in the UK, the dedicated SVOD platforms have more demand, both in terms of market share and average demand per title, than the broadcaster catch-up services.
Meet with the Parrot Analytics team at MIPCOM at stand P3.B4. in the Palais. Parrot Analytics’ CEO Wared Seger will also be participating in an hour-long panel titled “Defining a Hit: New Metrics for Success” at MIPCOM. The session will be held on Monday 16 Oct 2017 at 09:45, Esterel, Palais 5.
Parrot Analytics Digital Original Series – Global Demand Report Q2
MIPTrends is excited to be sharing Parrot Analytics’ latest in-depth global research report with you: The 2nd Quarter 2017 Digital Originals streaming report provides a comprehensive overview of SVOD content demand trends in 10 global markets. Parrot Analytics reveal the top digital original shows in each country and take a look at the demand trends for a selection of titles in each market over the quarter. Download the report now and discover the top SVOD titles in Q2 for Australia, Brazil, Canada, France, Germany, Mexico, Singapore, Turkey, United Kingdom and the United States.


