Late 2016, Ericsson published the seventh edition of its ConsumerLab TV & Media report. For those of you not familiar with ConsumerLab, I’m going to let you into a secret… In my humble opinion, it’s probably one of the best kept secrets in the industry.

Ericsson’s ConsumerLab TV & Media report is probably one of the largest consumer studies of its kind that looks into people’s behaviours and values, including the way they act and think about TV and media. It covers 24 countries and is statistically representative of 1.1 billion people worldwide. The ConsumerLab team has more than 20 years’ experience and gains its knowledge through a global research programme based on quantitative and qualitative methods and hundreds of hours spent with consumers from different cultures.
As you can imagine, there’s a huge amount of data in the report, so I thought I’d sum up a few key findings for you here as food for thought. If you’re interested in reading the report in full (along with the 100+ slides that go with it), then head here.
TV viewing increases as screens shift

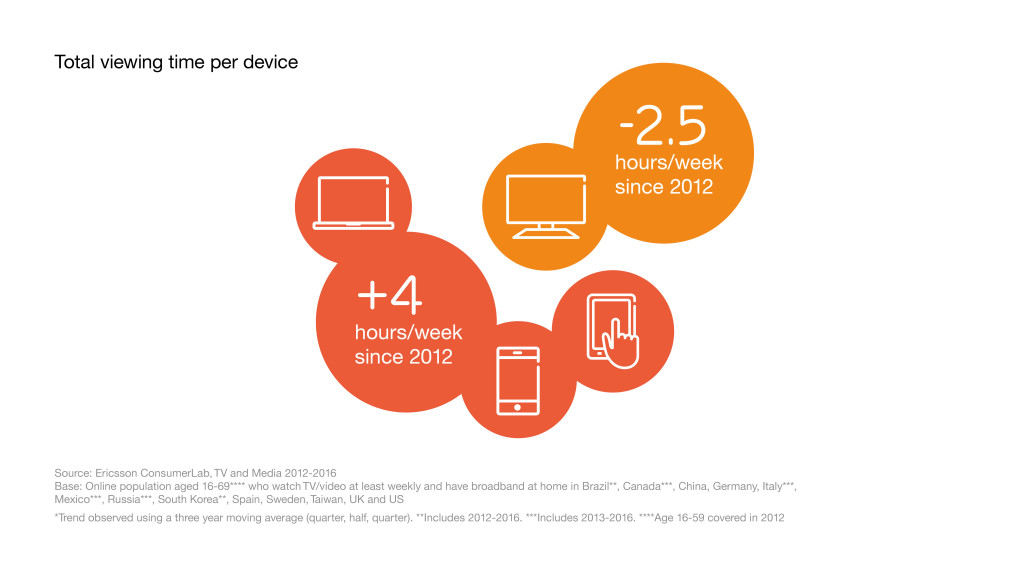
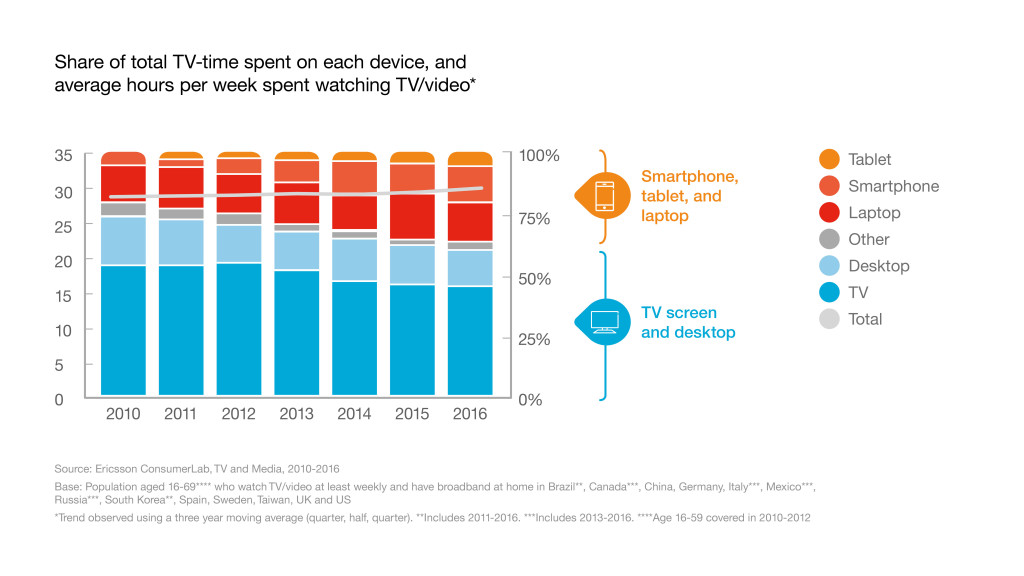
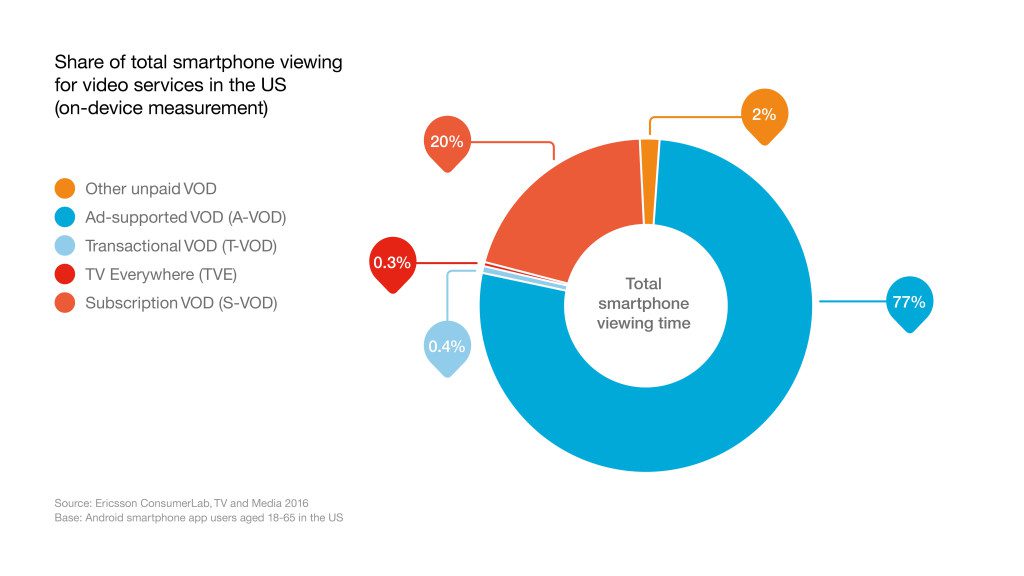
The first piece of good news is that overall viewing time is on the up and this has been driven by a significant uptake in mobile viewing. Since 2012, the average consumer has increased their viewing on mobile devices by four hours a week while their fixed screen viewing has declined by 2.5 hours a week. This means that today they spend an extra 1.5 hours watching TV and video than they did four years ago. And it’s not just the freebie, cats on skateboards kind of content that they’re watching – 20% of the content viewed on mobile devices is paid for. So there’s a reason for optimism; we’re not only seeing an audience shift but also a value shift to mobile devices.
Linear TV remains robust; on demand soars

We’ve all read the many and varied headlines declaring the death of linear TV. We all know that these statements are often exaggerated. What we’ve found in this year’s ConsumerLab report is that yes, scheduled linear broadcast has lost ground in terms of overall share of viewing, but its viewership in hours has actually remained pretty steady – declining only 16% since 2010 (which is the equivalent of almost one hour per week). That doesn’t sound like a death knell to me. And it’s worth remembering that even if scheduled linear TV is losing ground, it is still roughly twice the size of any other type of TV/video service. The other clear trend is the continual rise of non-linear viewership. Our findings show that streamed on-demand movies and TV programmes have increased their share by 50% since 2010, while short video clip viewing has grown its share by almost 90% in the same time frame.
Let’s take YouTube as an example. We’ve monitored how much consumers watch YouTube over the years and the trend is pretty clear. In 2011, 28% of our respondents said that they watched content on YouTube at least daily, out of which 3% claimed that they watch more than three hours a day. Fast forward to 2016 and we’ve seen a moderate rise, with 40% of respondents saying that they watch YouTube daily and as many as 10% of people saying that watch YouTube for more than three hours a day.
So viewing is going great guns, but what about the money? Our research points to growth in this area too. The average household spend shows a reasonably stable picture for broadcast, pay TV packages but in the same timeframe, we’ve seen an increased spend of 60% on non-linear or on demand services. The average US household now pays for 3.8 VOD services. What’s also interesting – and really underscores our love of on demand – is that typically people don’t pause their subscriptions while they’re waiting for new content, even though you can do so at the click of a mouse. Could we say the same about managed TV packages if it were as easy to quit? It would be interesting to see if the result would be the same.
So onto our next trend, a behaviour which the rise of on demand has very much fuelled… Binge viewing has been a feature of the landscape for some time now, clearly assisted by providers such as Netflix and Amazon. But while bingeing used to be a behaviour largely attributed to the much analysed millennials, what we’ve seen in this year’s findings is that bingeing is a behaviour which is broadening out amongst all age groups. A fifth (21%) of our respondents said that they now binge daily; 37% do it weekly and only 8% say they never binge watch content. But did you know that 18% of 60-69 year olds also binge watch on a daily basis?
Binge viewing is now very much a mainstream activity and one that we should expect to increase across all age categories. We’ve talked about new screens, new services and new devices. But what type of content is really gaining ground with consumers? Interestingly enough, when it comes to the type of content we’re watching, it’s still the same stuff that’s driving viewership. TV series, movies and TV programmes watched according to a fixed schedule top the bill with consumers spending on average 3.9, 3.6 and 2.6 hours on each respectively per week. Perhaps a little surprising is that UGC pops up in fourth place (2.5 hours per week).
But what about the all-important millennials? Well an interesting point to note is that millennials watch more content in total than the 35+ age group – 34 hours a week compared with 28 hours. In terms of what they watch, UGC is perhaps unsurprisingly in first place, followed (once again) by scheduled TV series and movie content.
Content discovery – how hard can it be?

So far we’ve seen that viewing has grown, that the device mix is evolving, linear is looking pretty healthy and on demand is going through the roof. All good, right? Well, broadly yes, but it’s also true to say that we’ve still got some challenges to address. 44% of US consumers say that they can’t find anything to watch on linear TV on a daily basis, an increase of 22% compared with last year (36%). In contrast, US consumers spend 45% more time choosing what to watch on VOD services than linear TV.
Paradoxically, 63% of consumers claim that they are very satisfied with content discovery when it comes to their VOD service, while only 51 percent say the same for linear TV. This, of course, could be indicative of two things – the richness of the content available or the effectiveness of the content discovery experience. In reality, it’s probably a combination of the two. Either way you look at it, the stats are still too high. Content discovery clearly remains a real issue for consumers and shows that we, as an industry, have room for improvement.
If we’re not careful, we’ll drown our audiences with the tyranny of choice and ultimately frustrate them. Moreover, cracking content discovery will go a long way to unleashing the true value of VOD. Ad blocking also continues to be a major challenge. The option of choosing “free from ads/commercials” now holds the top spot of features worth paying for, up from second place last year; more than 45% of our respondents agreed. Clearly this is very significant for our industry. Audiences have always stated a preference for ad-free TV but frankly, in the past, there hasn’t been a great deal that they could do about it. However, with more and more creative ad-blocking solutions available, the power is increasingly in their hands. 60% of our respondents said that ad-blocking is important to them and one in four want the ability to specify the ads that they never want to see again. According to eMarketer, 69.8 million Americans will use an ad blocker in 2016, a jump of 34.4% over last year. Next year, that figure will grow another 24% to 86.6 million people. It’s imperative that we consider the ‘inconvenient truth’ of ad-blocking because our industry needs advertising, it’s a fact.
I’ve called out here just a few of the strands that we’ve observed in this year’s Ericsson ConsumerLab TV & Media report but there is much, much more. If you’re interested in reading the report in full, you can access it here. The good news is that it is free!
Top photo: Kentoh © Getty Images


